Case study · Build · 2026
Fish Maps
A 3D map of San Francisco Bay showing where king tides land today and how much sea level rise makes them an everyday high.
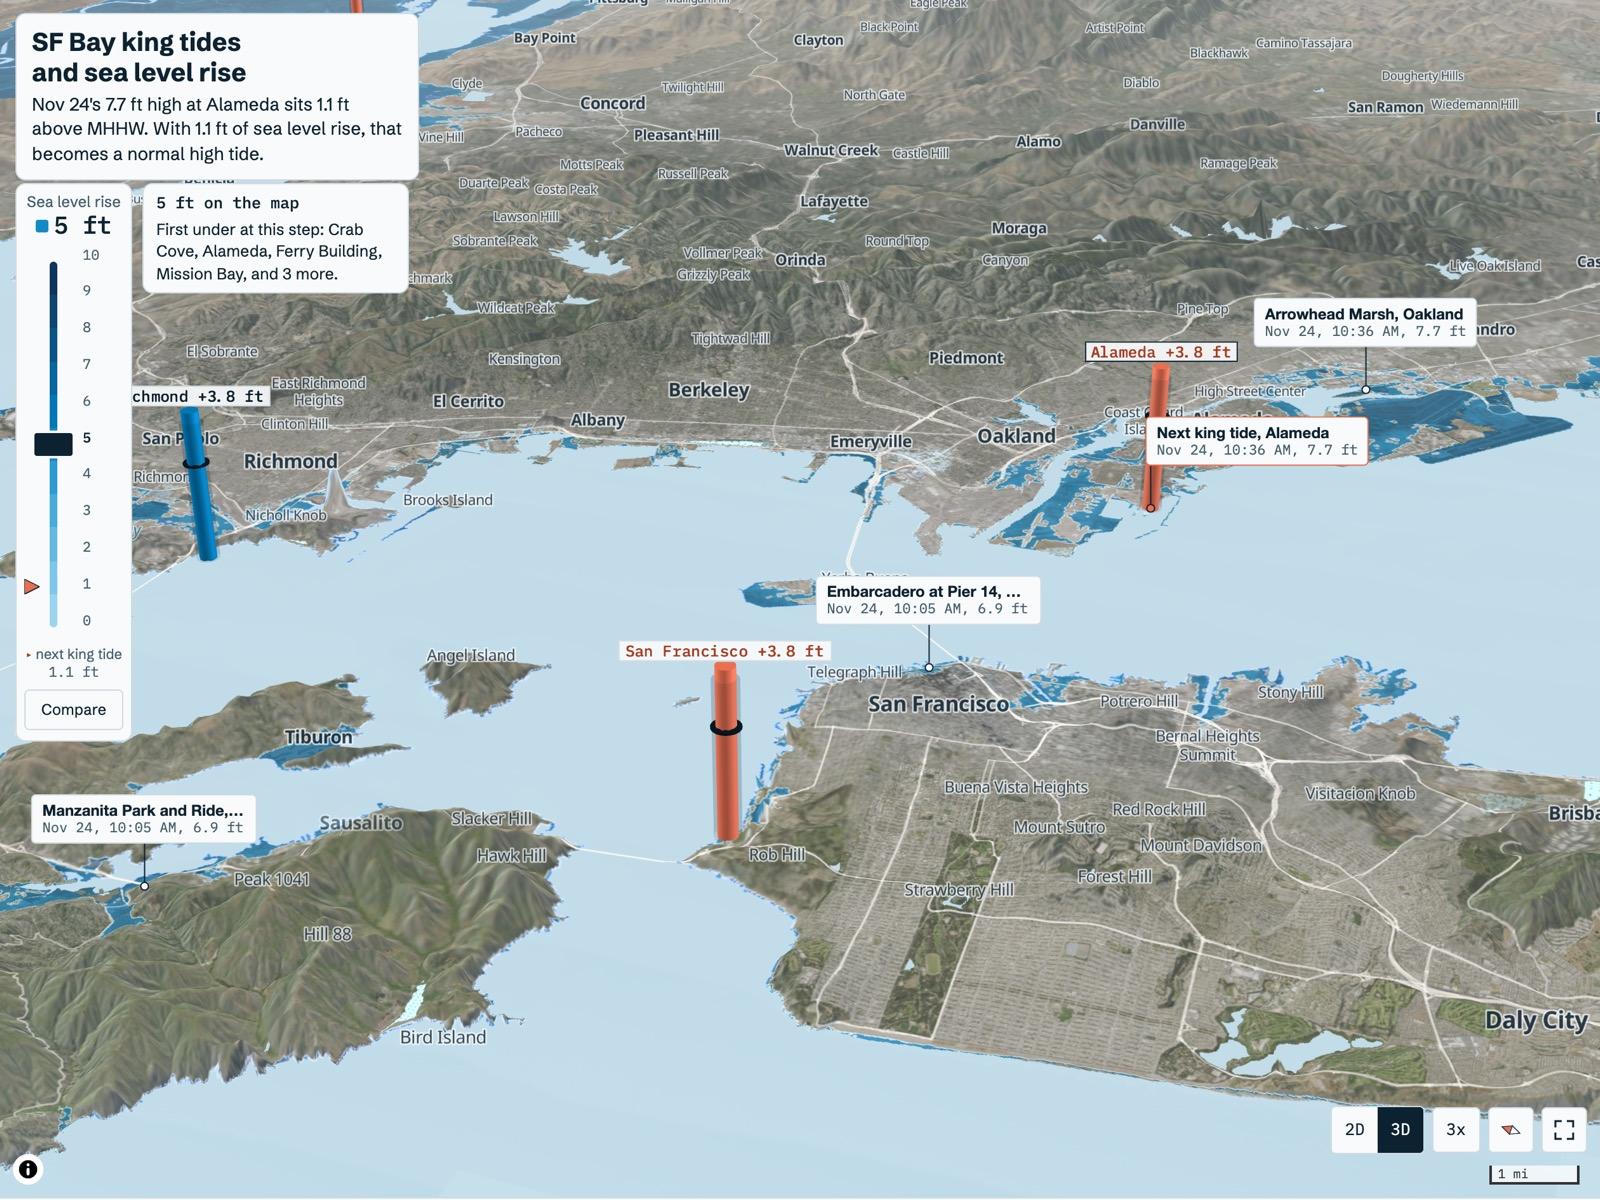
Fish Maps is a 3D map of San Francisco Bay that shows how much sea level rise turns the year's highest tide into an ordinary high tide. It ranks the highest predicted tides at 7 Bay gauges and draws NOAA's sea level rise water on the shoreline one foot at a time. It is built with Next.js, MapLibre, deck.gl and d3, and it has been live since November 6, 2026.
- What it doesSee the developer side
A 3D map of San Francisco Bay that shows where king tides land today and where everyday highs reach with 1 to 10 ft of sea level rise.
The short version
- 01
The question
How much sea level rise turns today’s highest tide of the year into an ordinary high tide, and where does that water go?
- 02
What I did
Built a 3D map that ranks the year’s highest predicted tides at 7 Bay gauges and draws NOAA’s sea level rise water on the shoreline, one foot at a time.
- 03
Where it stands
Live since November 6, 2026. Every source works with no key, and there’s no database.
Why I built it
A king tide is a preview of an ordinary high tide.
King tides are the highest predicted tides of the year. In San Francisco Bay they arrive around the winter and summer solstices. On a calm day one may only wet low paths and parking lots.
With enough sea level rise, that same water shows up on an ordinary day. Fish Maps puts a number on that gap at each gauge and draws the matching water on the shoreline.
Official dates and photos: California King Tides Project
What it does
Everything sits on one map of the Bay.
3D map
Seven Bay gauges on 3D terrain, with NOAA’s mapped water for 0 to 10 ft of sea level rise.
Tide scrubber
Plays the predicted tide and adds it to the slider, so the shoreline moves with the water.
King tide calendar
The 20 highest predicted tides in the next 12 months across the Bay, from NOAA alone.
Check a place
Tap the map or search an address to see the first foot of rise where that spot goes under, and roughly when the state expects it.
Go see it
The next king tide, when to arrive, a warning for peaks after dark and spots to stand at near the gauge.
Station pages
One page per gauge, with predicted days over its flood level today and with 1, 2 and 3 ft of rise.
Shoreline spots
15 places people go to watch king tides, each with the first NOAA step that floods it.
How I built it
Checks changed the build right up to launch.
- 01
87 source calls
86 came back OK
Skipped USGS CoSMoS. Its map service returned the one 404
- 02
NOAA’s live answers
Thresholds taken from station metadata
Sea level rise tiles at zoom 16, about 2.4 m a pixel
- 03
Spots traced to sources
Every fact matched to a source page, then re-checked
Wording scaled to the evidence behind it
Moved Sausalito, from Bridgeway to Kappas Marina, where the flooding is documented
- 04
Tests before launch
53 unit tests, every derived metric covered
25 browser tests at phone and desktop widths
Bug Floating-point math pushed a tide at the threshold over it
- 05
First real deploy
Flat land color hid the poster image on a cold load
Until imagery arrived, about 3 s on fast wifi
Fixed The canvas stays transparent until imagery loads, up to 8 s, and a browser test covers it
Some NOAA services answered wrong. The map works around each one.
How a spot page words its evidence
- water reporteda source reports water at the spot during king tides (8 spots)
- viewing eventa source reports a viewing event, and the page says only that (4 spots)
- dated photoa dated photo caption is the only record (2 spots)
- nothing foundno source documents king tide flooding there, and the page says so (Redwood Shores)
At the Embarcadero, reports show water at king tides, and NOAA’s layer first floods it at 4 ft. Its page says so. That gap is a limit of the screening layer.
The 3D map
Buildings turn coral when the water reaches them.
I modeled the map on FireTrace, Dilum Sanjaya’s wildfire map. It recolors its imagery with a Mapbox paint property that MapLibre doesn’t have.
So Fish Maps repaints each USGS imagery tile in the browser onto a gray-blue ramp. It keeps a quarter of the original color, so marsh and mudflat still read apart from pavement.
The map I modeled this on: FireTrace
Buildings in the water
From zoom 15, every building on screen is tested against NOAA’s connected water at the foot the map shows. Wet ones turn coral, and the slider panel counts them.
Staff gauges
Each gauge stands as a staff marked every foot. A 6 ft figure stands at the high-tide line for scale.
Key events
Each day’s highest high this week, king tides, crossings of the minor flood level and the largest observed surge. Each row jumps the scrubber.
Terrain height
1x, 2x, 3x or 5x, saved in the link. The Bay floor is set flat so the water stays one surface.
- coral buildingone whose footprint center sits in NOAA’s connected water at the whole foot the map shows
That’s one point per building tested against a screening layer, so a coral building may stay dry and a gray one may not. Up to 1,500 buildings are tested at a time, or 600 on phones.
How it works
No database, and no keys.
- 01
NOAA CO-OPS
Tide predictions
Observed water levels
Datums and flood levels
- 02
Next.js server
Cached pages
King tide and flood-day math
Refreshes Predictions once a day from a Vercel cron, observed water every 6 minutes
- 03
Browser map
MapLibre with 3D terrain
deck.gl gauge staffs
Also reads NOAA sea level rise tiles, repainted pixel by pixel
NOAA caps high and low requests at a year and 6-minute requests at a month, so longer ranges get split. Datums and flood levels change rarely, so a script builds them once and they’re committed.
The math
Every number starts from mean higher high water.
Mean higher high water (MHHW) is the average height of each day’s higher high tide. It’s where the shoreline sits on an ordinary day.
- height above MHHWpredicted height minus MHHW
- future-tide equivalentthe larger of 0 and the height above MHHW
- surgethe largest gap between observed and predicted water in the last 72 hours
The equivalent is the sea level rise at which a water level becomes an ordinary daily high. It assumes the tide range holds as the sea rises.
- days(+x ft)Pacific days with a predicted high where height + x minus MHHW tops NOAA’s minor flood level
Counted for 0 to 3 ft of rise over the next 12 months. Three gauges have only an action level, and their pages count that and say so.
- levelslider + the tide above MHHW at the selected gauge
- first flood stepthe lowest foot where a quarter of a 5 by 5 grid of points at the spot is wet and connected
NOAA publishes one layer per whole foot. At 2.4 ft the map draws the 2 ft water plus 40 percent of the band between 2 and 3 ft. That blend is visual, since NOAA models no fractional feet.
What it found
At Alameda, 2 ft of rise tops the flood level on more than half the days of the year.
The week Fish Maps went live, five Bay gauges ran about 1.05 to 1.13 ft above prediction, with a 1.6 ft peak at Alameda on November 3. Predictions use a 1983 to 2001 reference, so part of every gap is sea level rise that has already happened.
What the data got wrong
NOAA’s own services gave a few wrong answers.
The identify service returned the same polygon at every point
NOAA’s tiles paint the whole Bay one navy
The terrain tiles include Bay bathymetry
Only four of seven gauges have a minor flood level
First-pass spot points sat on high ground
8.5 − 6.6 comes out to 1.9000000000000004
USGS imagery bands over open water
Decisions
Small choices that keep the map honest.
Official dates kept apart
A row gets an official tag only once a Coastal Commission date is entered by hand. The computed peaks never stand in for those dates.
Point Reyes off the Bay calendar
It sits on the open coast and took 13 of the top 20 rows.
A light map
The project brief asked for a light map at #eef3f5, so Fish Maps breaks from the dark maps in the series.
Staffs drawn to be read
A 2 m tide range across a 30 km view is under a pixel at true scale. Staffs scale to the screen, and each label prints the true value.
The map waits on phones
It boots on the first touch or 3.5 s after load.
MapLibre pinned to 5.24
Grid Watch broke on version 6, so Fish Maps follows its pin.
Design
The water darkens with every foot.
Flooded land takes a blue that darkens with each foot of rise, over a light gray-blue map. Coral marks a staff past its flood level or a building in the water. Every step prints its foot value, so color never carries meaning alone.
Type
Schibsted Grotesk for text and IBM Plex Mono for heights and times.
Eleven steps
Lightness falls at every step from 0 to 10 ft, in normal vision and simulated deuteranopia.
| Item | Normal | Deuteranopia |
|---|---|---|
| Water vs flood coral | 93.9 | 89.1 |
| Bay tint vs the 6 ft step | 50.7 | 53.6 |
Where it stands
Live, with the king tide season ahead.
- Tide gauges
- 7
- Tide gauges
- Shoreline spots
- 15
- Shoreline spots
- Unit tests passing
- 53
- Unit tests passing
- API keys
- 0
- API keys
| Item | Performance | Accessibility | Best practices | SEO |
|---|---|---|---|---|
| Map | 100 | 100 | 100 | 100 |
| Crab Cove spot page | 100 | 100 | 100 | 100 |
| Alameda station page | 94 | 100 | 100 | 100 |
| King tide calendar | 94 | 100 | 100 | 100 |
What’s next
What I’d add after the first winter.
Next
Storm scenarios
USGS CoSMoS models storm flooding on top of sea level rise. I found no public map service for it yet.
A phone test
Interaction timings so far come from a laptop GPU with the CPU throttled.
Official dates
Enter the Coastal Commission’s dates by hand. The dates file is still empty, so no row carries an official tag yet.
Checks in CI
Run the tests and the source check on every pull request. So far they run locally.
Known limits
Screening layers
NOAA’s layers leave out storms and waves. A flooded step is a reason to go look.
No weather in predictions
Tide predictions cover astronomy alone. The surge readout shows how far real water is running from them.
No dates on the steps
Sea level rise here is a set of what-if steps. Fish Maps makes no forecast of when any step arrives.
TL;DR
Built
A 3D map of the Bay that ranks king tides at 7 gauges and draws sea level rise by the foot.
Found
At Alameda, 2 ft of rise tops the minor flood level on 198 predicted days, more than half the year.
By the numbers
- Days over Alameda’s minor flood level with 1 ft of rise
- 22
- Days over it with 2 ft of rise
- 198
- Days over it with 3 ft of rise
- 341
The catch
The rise steps are what-ifs. Fish Maps makes no forecast of when 2 ft arrives.
Next
Add USGS CoSMoS storm flooding on top of sea level rise once I find a public map service for it.