Case study · Build · 2026
Chain Routes
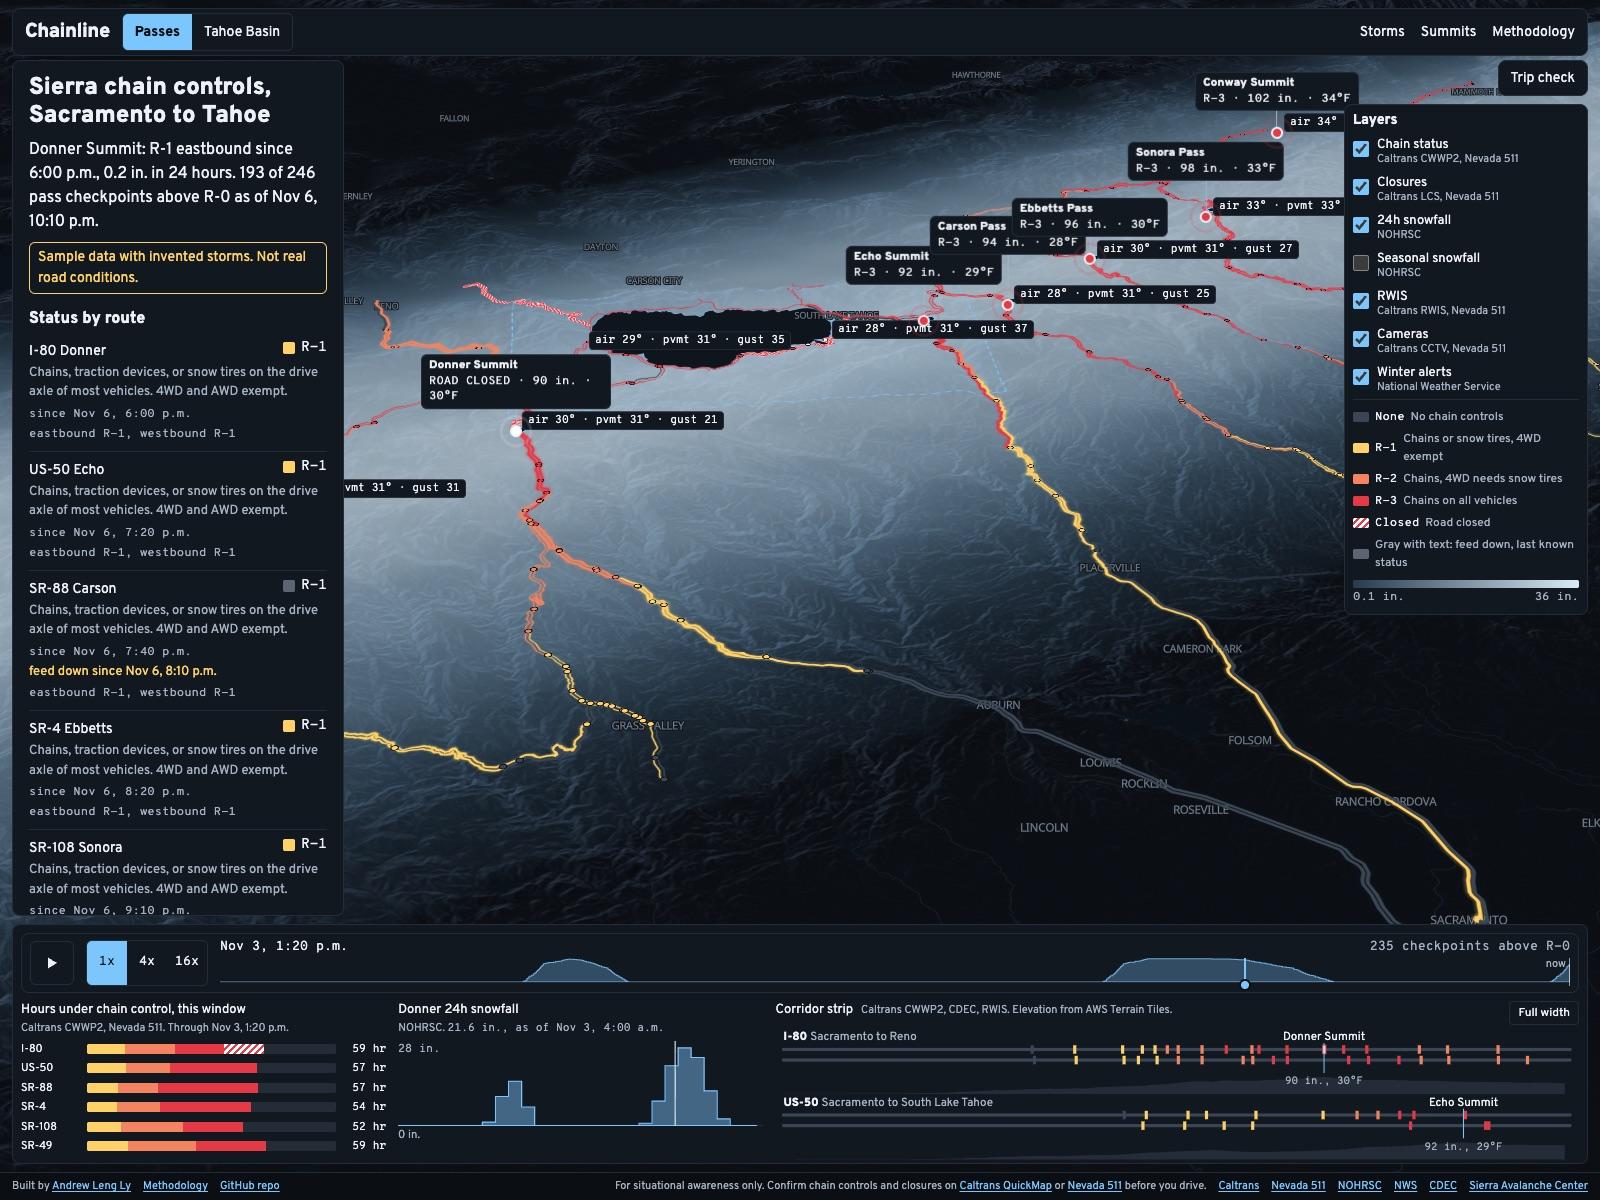
A 3D terrain map of Sierra chain controls between Sacramento and Tahoe. It stores every change, so each storm can be replayed.
Chain Routes is a 3D terrain map of Sierra chain controls that saves every checkpoint every 10 minutes, since Caltrans publishes the current status only. Each storm between Sacramento and Tahoe can be replayed. It is built with Next.js, MapLibre, deck.gl and Supabase, and the snapshots it has stored since November 7, 2026 go public once the first build merges.
- What it doesSee the developer side
A 3D terrain map of Sierra chain controls and closures, for deciding whether to drive up this weekend.
The short version
- 01
The problem
Caltrans publishes chain controls as current status only. Nobody can look up what I-80 did last Saturday.
- 02
What I did
Built a map that saves every checkpoint every 10 minutes and lines it up with snowfall and the next storm at each summit.
- 03
Where it stands
Tested on sample storms, with snapshots stored since November 7. That history goes public once the first build merges.
Why I built it
Chain controls drop out of the record the moment they lift.
Chain Routes answers one question. Should I drive up this weekend, and when?
Caltrans publishes chain control status as current-only. Once controls lift, they’re gone from the feed, so nobody can check how long Donner sat at R-2 last Saturday or how fast it cleared.
So Chain Routes keeps its own record. Every 10 minutes it reads every checkpoint between Sacramento and Tahoe and stores each change.
The feed Chain Routes reads: Caltrans CWWP2
What it does
The passes and Tahoe share one map.
Passes map
Chain controls and closures on the Sierra passes from Sacramento to Tahoe, over snowfall on 3D terrain.
Tahoe Basin map
The lake loop and its summits, with Nevada 511 conditions placed on the same R-level ramp.
Replay
A scrubber that steps through each 10-minute frame. Watch a storm close the passes and clear them.
Trip check
Pick one of 16 routes and a departure up to 72 hours out. It estimates when you reach each summit and shows the NWS forecast for that hour.
Summit pages
13 pinned summits, each with current conditions and its last five storms.
Storm log
Each storm gets a page with its hours under control by route and its time to clear at each summit.
Methodology
Every source and formula in plain language, plus the full chart of status codes.
How I built it
I started from what the feeds really send.
- 01
Source check
One script calls every source once
CI runs it on every pull request
- 02
Test fixtures
Trimmed copies of live responses
Nevada 511 samples written from its docs
- 03
Tests
Unit tests on saved responses and SQL migrations
20 of 20 Playwright tests on sample storms
Crawl 39 links, none broken
- 04
Color review
Deuteranopia simulated on each status step
I kept R-2 and R-3, the closest pair at ΔE 13.3
- 05
Schedule
The snapshot job started November 7
Runs 852 by November 12, with no failed jobs
Where a feed broke one of my assumptions, the parser or the rule changed to fit the feed.
The 3D map
The snow level sits right on the mountains.
I modeled the map on FireTrace, Dilum Sanjaya’s wildfire map. It recolors its imagery with a Mapbox paint property that MapLibre doesn’t have.
So Chain Routes repaints each USGS imagery tile in the browser onto a night blue-gray ramp. The ramp stays dark so every route keeps its contrast.
The map I modeled this on: FireTrace
Snow level
The NWS snow level at each summit, spread across the map. Ground above it turns frosty, under a labeled ice-blue line.
Follows your trip
The line uses the current hour, or your departure once a trip check is set. Snow level is a forecast and isn’t stored, so past replay frames leave it off.
Conifers
Cones on OpenStreetMap woodland at three times life size, mostly between 3,000 and 8,500 ft and thicker on north-facing slopes. Above the snow level they get white caps.
Checkpoint posts
Controlled checkpoints stand as posts in their status color. Up to six carry a chip like R-2 · since 4:10 AM, most severe first.
Key events
The first control on each route, closures and reopenings, each route’s peak and the all clear. Each row jumps the replay and flies to the checkpoint.
Terrain height
1x, 1.5x, 2x or 3x, saved in the link so a shared view opens the same way.
Here d is the distance to each pinned summit in km, never under 0.5. Frost covers ground above that level on a 384 by 384 elevation grid from zoom 9 terrain tiles, or zoom 10 for the Tahoe Basin. Away from the summits the line is an estimate.
How it works
A scheduled job keeps the record every 10 minutes.
- 01
Caltrans and Nevada 511
Chain control status
Lane closures and road weather
- 02
Snapshot job
Supabase Edge Function
Stores each change
Checks every record’s time
Runs on pg_cron every 10 minutes
- 03
Postgres
Its own chainline schema
Public reads through views
Shares a free project with Grid Watch
- 04
Next.js site
Passes and Tahoe maps
Storm and summit pages
Also reads NOHRSC snowfall grids from a GitHub Actions job twice a day, plus NWS forecasts
When the database is missing or fails, the site reads the feeds directly. It shows one frame with no past, and the map keeps working.
The math
Each number has one fixed definition.
Every day and time boundary uses Pacific time. Definitions stay fixed once published, so this season can be compared with the next.
- hours(route, level)time when the highest checkpoint on the route sits at that level
A route counts while at least one checkpoint is above R-0. Overlapping checkpoints never double count.
- storm openswhen a checkpoint on I-80, US-50, SR-89 or SR-267 leaves R-0 for 3 hours or more
- spells mergewhen they fall less than 12 hours apart
- time to clearhours from the last hour of snow depth gain over 0.5 in. to R-0 at every checkpoint near the summit
A Nevada basin segment reporting chains or a closure for 3 hours also opens a storm. A spell longer than 14 days counts as a seasonal closure and can’t start one.
A Saturday window runs 6:00 to 10:00 a.m. It counts as controlled if any checkpoint shows a status above R-0 in any frame inside it. I-80 is scored westbound and eastbound on their own.
- thresholdmedian NOHRSC 24-hour snowfall at the summit for the period when controls went up
The summit page waits for 10 storms before it shows one, and prints the sample size beside it.
What the data got wrong
The live feeds broke a few of my assumptions.
I pulled every feed live before writing a metric. Each of these would have written false history.
Caltrans sometimes serves an old copy of a file
Some weather stations stay in service long after their last reading
District 3 lists each checkpoint several times with letter suffixes
The District 10 weather file ships malformed JSON
Nevada has no R codes
Supabase returns at most 1,000 rows per request
The Central Sierra Snow Lab reports no hourly depth
Decisions
Built so a stale file can’t write false history.
A line for each direction
Eastbound and westbound have their own road lines, so a segment’s status follows the way you’re driving.
Retention that keeps the numbers true
Raw rows age out after 120 days. The rows that weekend odds and closure totals depend on stay.
Truck-only codes on the R-1 step
They restrict some traffic with no rule for cars.
A schema of its own
Chain Routes lives in a chainline schema inside the free Supabase project that runs Grid Watch.
Its own secret for the schedule
The cron call signs in with a random secret kept in Vault, so the service role key never goes there.
The map loads after the page
It starts 1.2 s after load on desktop and 2.5 s on a phone, or as soon as you interact.
Design
Roads stay the brightest thing on the map.
Chain levels run from yellow to red over a near-black map, and closed roads turn white with a hatch. Every status prints its Caltrans code and plain meaning beside the color.
Type
Overpass for text and Overpass Mono for every code and reading.
Feed down in gray
When a feed goes quiet, the map keeps the last known status in gray and prints when the feed went down.
| Item | ΔE | Lightness |
|---|---|---|
| None to R-1 | 90.3 | 29 to 87 |
| R-1 to R-2 | 23.1 | 87 to 70 |
| R-2 to R-3 | 13.3 | 70 to 57 |
| R-3 to closed | 59.2 | 57 to 100 |
Where it stands
Tested on sample storms and waiting on a real one.
- Between snapshots
- 10 min
- Between snapshots
- Summit pages
- 13
- Summit pages
- Routes in the trip check
- 16
- Routes in the trip check
- Unit tests passing
- 130
- Unit tests passing
The last source check ran 29 sources with no failures and skipped Nevada 511, which needs a key. Its parsers are built from the published docs.
| Item | Performance | Accessibility | Best practices | SEO |
|---|---|---|---|---|
| Passes map | 100 | 100 | 100 | 100 |
| Tahoe Basin map | 100 | 100 | 100 | 100 |
| Donner Summit page | 100 | 100 | 100 | 100 |
What’s next
What I still need to check.
Next
The first real storm
Swap the sample storm on this page for a real one once history builds.
A live Nevada check
Run the Nevada parsers against a real 511 key.
A phone test
Map timings so far come from a laptop. A real phone will differ.
The snowfall upload
Turn on the upload to Supabase storage. So far the grid job has run against NOHRSC with the upload off.
Known limits
Up to 10 minutes old
Chain rules change by the minute, so Caltrans QuickMap and Nevada 511 have the final word.
No road forecast
The forecast covers snow. It can’t say when Caltrans will put chains up.
Early odds
Weekend odds describe this season so far and carry little weight early on.
TL;DR
Built
A 3D terrain map of Sierra chain controls from Sacramento to Tahoe, saved every 10 minutes.
Found
130 unit tests pass, and the last source check ran 29 sources with no failures.
By the numbers
- Unit tests passing
- 130
- Sources in the last check, no failures
- 29
- Routes in the trip check
- 16
The catch
Every result so far comes from sample storms. The page is still waiting on a real one.
Next
Replace the sample storm with the first real storm once enough history builds up.