Case study · Data study · 2026
The case for third places
Seven studies on loneliness and the places people gather, run to decide where FourthSpace, the community app I’m building, launches in Sacramento.
A series of seven data studies on loneliness and the places people gather, run to decide where FourthSpace launches in Sacramento. It runs survey-weighted models on federal microdata, including 540 versions of the social media link, and maps walk access to indoor venues across Sacramento County. Built with Python, pandas, statsmodels and geopandas, it recommends a launch in south Sacramento with library branches as the first venues.
- The questionSee the analyst side
Do people need more places to meet in person, and where in Sacramento should FourthSpace start?
The short version
- 01
The question
Do people need more places to meet in person, and where in Sacramento should FourthSpace start?
- 02
What I did
Ran seven studies on time diaries, CDC surveys, county business counts and a walk network I built for Sacramento. Every figure went into one stat bank with its source.
- 03
Where it stands
Done in November 2026. I picked south Sacramento for the launch, with library branches as the first venues. The findings also went into the FourthSpace pitch deck.
The question
An app for meeting people in person only works if people want to meet.
FourthSpace is a community app I’m building for finding third places that are open right now. Think coffee shops, libraries, trails and farmers markets. It launches in Sacramento.
Before launch I wanted the data to settle where in Sacramento it starts and who it starts with.
I came in thinking phones and social media push people into isolation. I was partly right.
How I did it
Seven studies on public microdata, with every number kept in one stat bank.
- 01
Scope
10 questions scoped
7 run, each tied to a launch call
- 02
Microdata
ATUS diaries, 2003 to 2025
CDC YRBS and PLACES
- 03
Weights
Each survey’s design weights
Taylor-linearized variance
- 04
Every model
540 social media models
The full spread kept
Why One model can be tuned toward an answer, so I ran every reasonable one
- 05
On foot
Walk network from TIGER roads
Freeways and ramps removed
- 06
Stat bank
Year, source and caveat per figure
A flag for landing page use
- walk accessthe share of a tract’s street intersections within 800 meters of an indoor gathering place, about a 10-minute walk
- priority tracta census tract with higher loneliness and low walk access
- lonely adultsthe CDC PLACES crude rate times the adults who live there, an estimate built on a model
Before writing any finding, I checked my weighted rates against the figures the CDC and Census publish for the same year.
What I fixed along the way
Bookstores at zero
The 2022 and 2023 business files still list bookstores under the 2017 industry code. Reading them with the new code matched nothing, so I kept the 2017 code for every year.
Winding roads counted twice
My first access measure counted every point along a road’s shape. It now counts intersections only.
An institution on top
A special land-use tract topped my first ranking. Tracts numbered 98xx and 99xx are now out of every ranking.
A wrong place name
My first map caption put the hot spots in the northern suburbs. Matched to ZIP codes, they sit in south and north Sacramento.
What the data shows
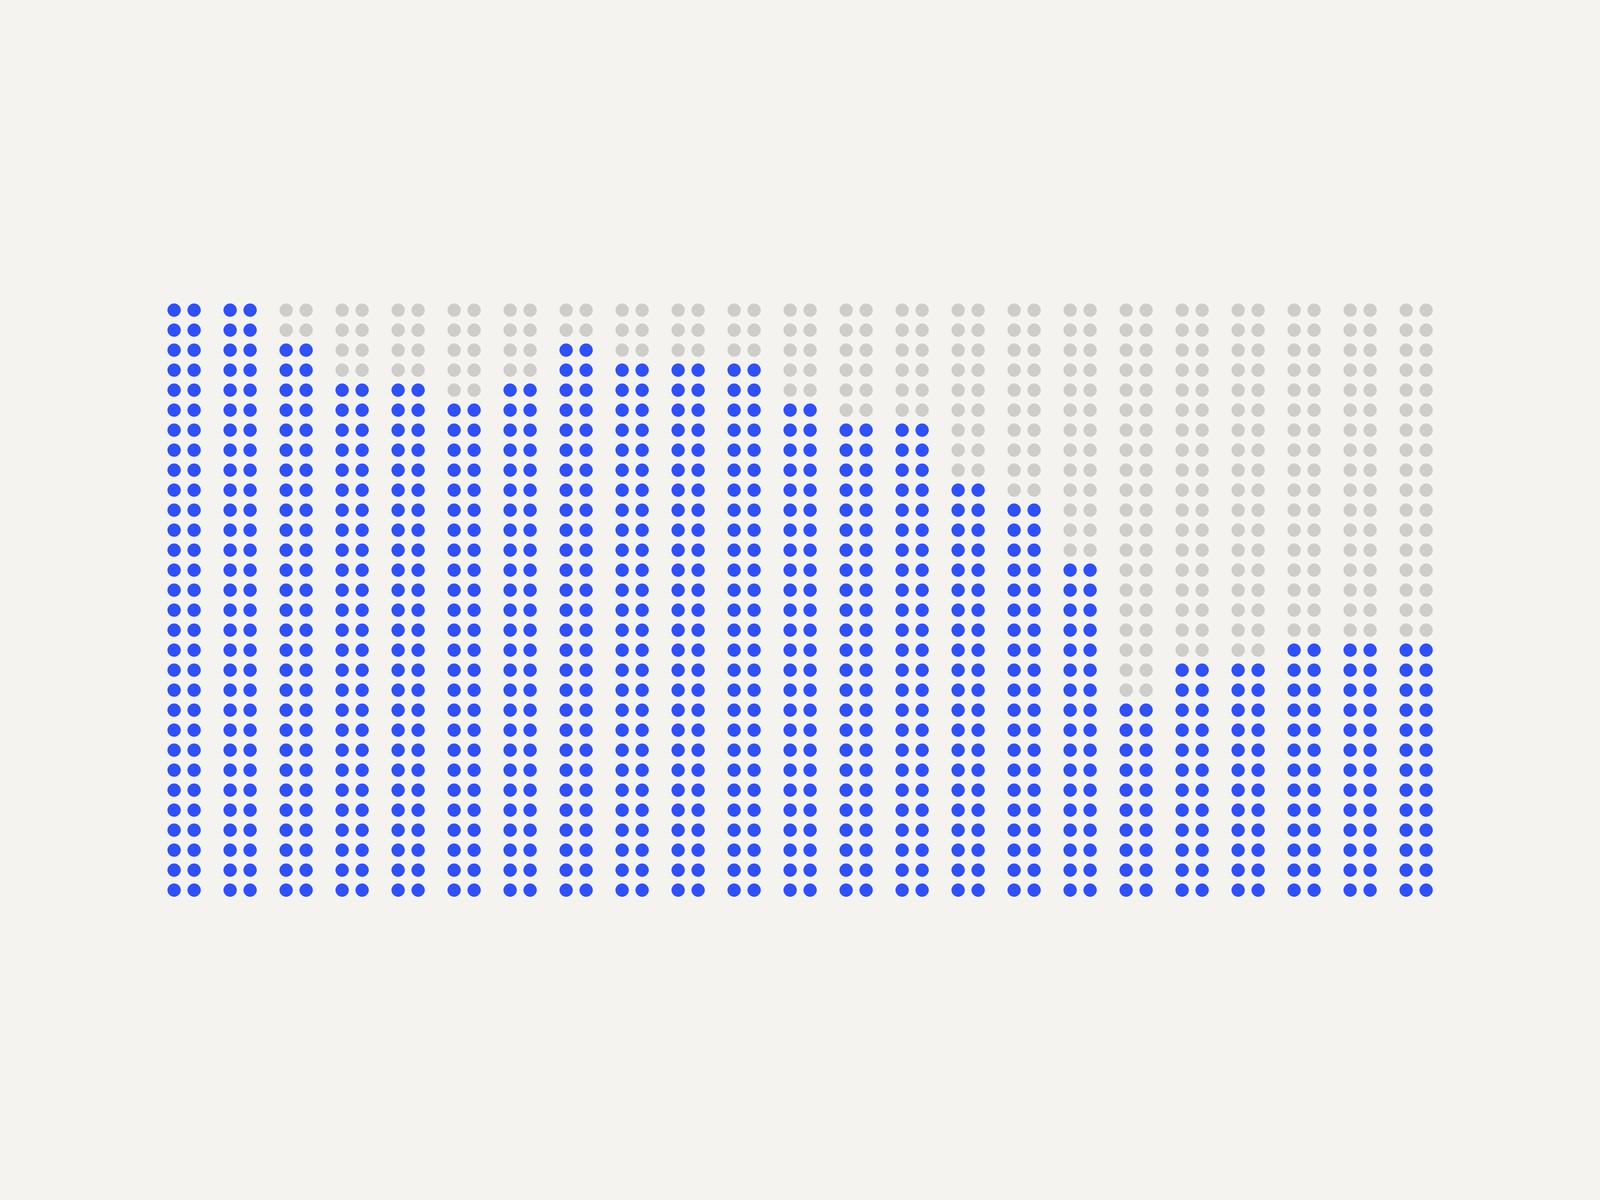
Time with friends fell by more than half since 2003.
Heavy social media use does go with more sadness. Bullying and weak ties at school go with far larger gaps. Each bar is an association from one survey wave, and the direction is open too, since sad teens may turn to social media more.
Sacramento
Sacramento County is lonelier than 95% of U.S. counties.
- Adults lonely at least sometimes, 2023
- 39.5%
- Adults lonely at least sometimes, 2023
- California counties, loneliest first
- 2 of 58
- California counties, loneliest first
- Lonely adults in the county, my estimate
- ≈477K
- Lonely adults in the county, my estimate
- Priority tracts
- 36
- Priority tracts
The 36 priority tracts hold about 52,000 lonely adults, and 22 of them sit inside a loneliness hot spot. Of those tracts, 34 have no indoor venue mapped at all.
Most of the hot spot tracts sit along the Florin Rd and Stockton Blvd corridors in south Sacramento.
Where people gather
Civic clubs per person fell by 40% in 25 years.
Americans spent 83 minutes a day at third places in 2003 and 67 in 2025. Time at home grew by 74 minutes a day over the same years.
My recommendation
Launch in south Sacramento, with the library branches as the first venues.
A. Start in the loneliest neighborhoods
B. Make the library the anchor partner
If library approval runs long, the branches can still be listed as public places while the partnership is worked out. The research also became a 12-slide pitch deck and a ranked list of venues to call.
Limits
What this data can’t tell you.
Cause
Every link between loneliness, phones, places and health in these studies is an association.
Modeled rates
PLACES fills in counties and tracts from a statewide model, so the 477,000 and 52,000 figures are estimates built on estimates.
Counts and minutes
Business counts and diary minutes say nothing about how a place feels or whether people meet anyone there.
Map gaps
Walk access depends on OpenStreetMap. A venue missing from the map makes a tract look emptier than it is.
What’s next
What I’d add with local and first-party data.
Local teens
Ask the California Healthy Kids Survey for Sacramento County results, to see whether the school ties pattern holds here.
Two waitlist questions
Add optional questions on loneliness and volunteering to the FourthSpace waitlist, to build a first-party measure over time.
Foot traffic
Test Advan or SafeGraph visit data in the priority tracts. It costs money, so it stays optional.
Remote work again
Rerun the workday finding with the 2026 ACS once it shows what the return-to-office order did.
TL;DR
Studied
Where my community app FourthSpace should launch in Sacramento, worked out across seven studies on loneliness.
Found
Americans 15 and up went from 60.0 minutes a day with friends in 2003 to 26.5 in 2025.
By the numbers
- Minutes a day with friends, 2025
- 26.5
- Lonely adults in the county, my estimate
- ≈477K
- Priority tracts
- 36
The catch
The Sacramento loneliness rates come from a statewide model, so the local counts are estimates built on estimates.
Next
Ask the California Healthy Kids Survey for Sacramento County results to test the school ties pattern locally.